

Summary:
- XRP is holding a key support zone around $1.30-$1.33 after weeks of selling pressure.
- The token traded near $1.36, gaining about 1.3% in the last 24 hours.
- Daily trading volume jumped to $2.55 billion, signaling renewed market activity.
- Futures trading volume climbed 63% to $3.54 billion, while open interest rose to $2.33 billion, according to CoinGlass.
- Technical levels show resistance near $1.39-$1.42, while failure to break higher could push the price back toward $1.35 or lower.
The price of XRP is attempting to stabilize after several weeks of selling pressure, with the token holding a crucial support zone around $1.30. At the time of writing, XRP was trading near $1.36, reflecting a modest 1.3% increase over the past 24 hours. Over the previous week, the asset moved within a relatively tight range between $1.33 and $1.45, showing signs of consolidation after a broader downward move. Despite this recent stabilization, the token remains significantly below its previous peak. XRP is currently about 62% below its July 2025 all-time high of $3.65, highlighting how far the market has retraced since the last major rally.
Market activity, however, has started to increase again. Accroding to coinmarketcap, todays trading volume climbed to $2.36 billion, representing a 18.65 % jump compared with the previous day. Rising volume often indicates growing participation from traders and investors who are repositioning as the market looks for its next direction. Derivatives markets are also showing renewed activity. Data from CoinGlass shows that futures trading volume rose 5.93% to $3.30 billion, while open interest increased by 2.5% to $2.33 billion.
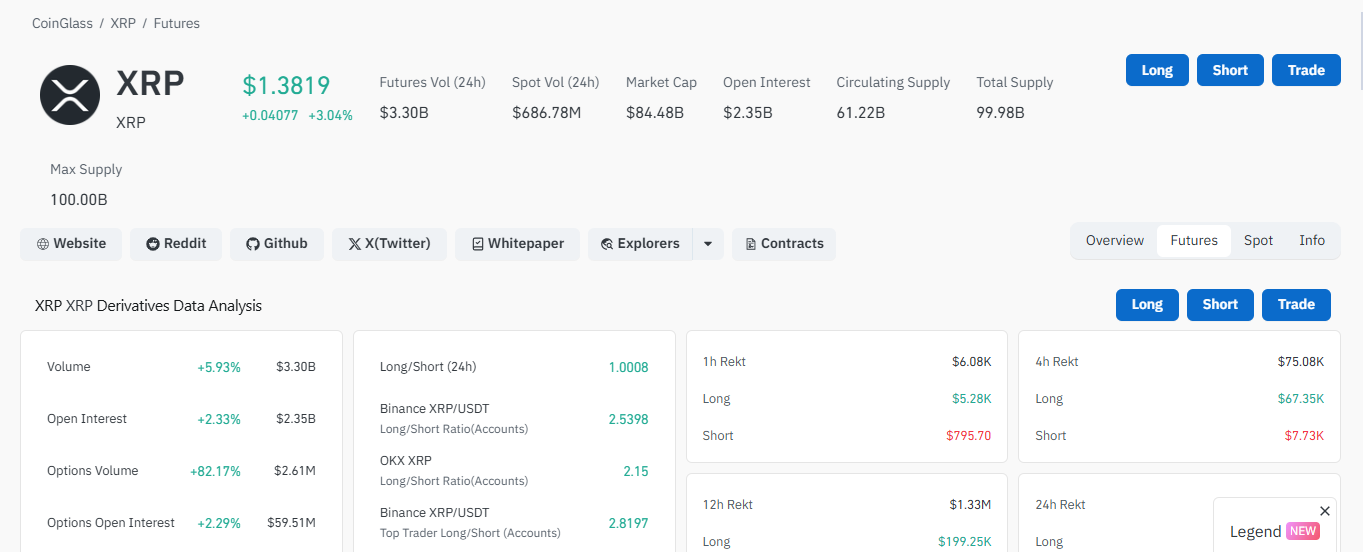
Open interest measures the total number of active futures contracts that remain open. When this number increases alongside trading volume, it often suggests traders are entering new positions rather than simply closing old ones. That move in derivatives activity points to growing speculation about where XRP might move next.
XRP Technical Outlook: Resistance Levels Could Shape the Next Move
From a technical perspective, XRP is currently trading just above an important support zone between $1.30 and $1.33. This area has been tested multiple times on the daily chart, and recent price candles show sideways movement slightly above the level. Such behavior often indicates that buyers are attempting to defend the area and prevent further declines. The price also managed to recover slightly after falling earlier, moving above $1.3350 and $1.350, which placed the token back into a short-term positive range. This recovery mirrors similar short-term movements seen in broader crypto markets, including Bitcoin and Ethereum.
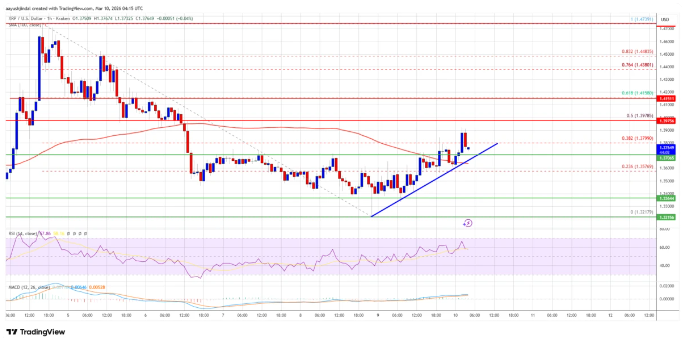 Source: News btc analysis
During the rebound, XRP moved above the 23.6% Fibonacci retracement level of the previous decline from the $1.4739 swing high to the $1.3217 low. Fibonacci retracement levels are commonly used in technical analysis to identify potential resistance or support zones where price reactions may occur. There is also a developing bullish trend line with support near $1.3705 on the hourly chart for the XRP/USD pair. This line represents a short-term structure where buyers have repeatedly stepped in during minor pullbacks. Still, upward momentum has faced resistance. The price briefly pushed above $1.3850, but buyers struggled to maintain control above $1.3800. XRP is currently trading above $1.370 and the 100-hourly Simple Moving Average, which provides some technical support in the short term.
If buyers attempt another push upward, analysts say the first resistance level to watch sits around $1.3880.
Key Resistance and Downside Scenarios Traders Are Watching
The next phase for XRP will likely depend on how the price reacts around several nearby resistance zones. The first major resistance level sits around $1.3980, which also aligns with the 50% Fibonacci retracement level of the recent downward move. If the market manages to close above that level, analysts believe the price could move toward $1.4120. A continued move higher may then face resistance around $1.420, another important technical barrier. Breaking above that region could open the door for a broader recovery, with potential targets near $1.450 and $1.4650 if bullish momentum strengthens.
However, the chart also presents a downside scenario. If XRP fails to break through the $1.3980 resistance zone, sellers could regain control of the short-term trend. The first support level on the downside sits near $1.370, which coincides with the short-term trend line. Below that, the next major support appears near $1.350. A confirmed break below this level could push the price toward $1.3360, followed by another support zone around $1.3220. If bearish pressure continues and XRP closes below that level, analysts say the market could revisit $1.3050.
READ MORE: Ripple Prime Adds Coinbase Crypto Futures for Institutional Trading in Regulated U.S. Market